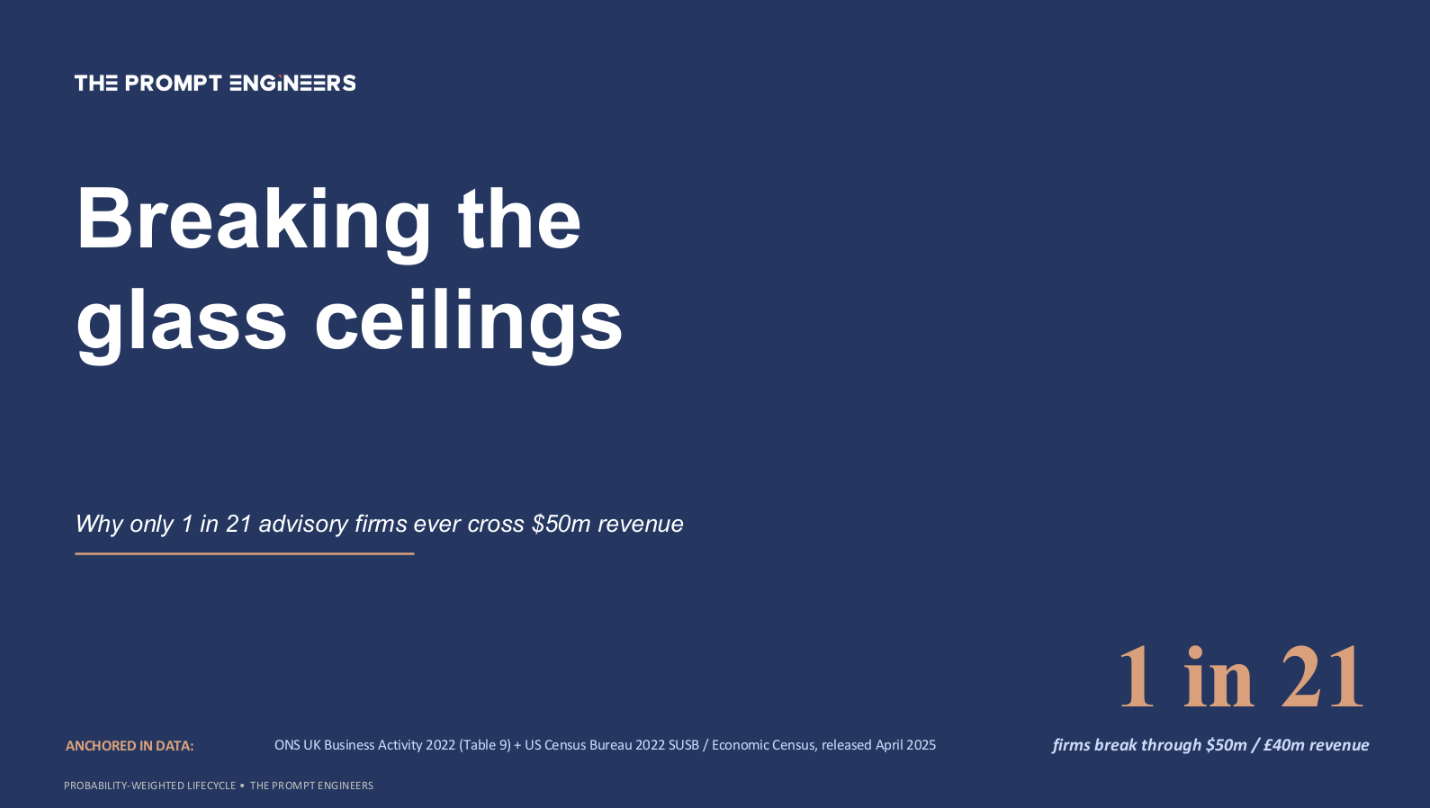
Breaking the glass ceilings: why only 1 in 21 advisory firms ever cross $50m revenue
.webp)

In brief
- Across the population of UK and US tech-enabled advisory firms above $1m revenue, only ~55 in 100 sit above $2.5m; only ~32 above $5m; only ~17 above $10m; only ~10 above $20m; and only ~5 above $50m.
- This is the precise empirical signature of the lifecycle described independently by Larry Greiner (1972), Neil Churchill and Virginia Lewis (1983), and David Maister (1993), and explained mechanically by Edith Penrose’s 1959 theory of the firm.
- The $20m wall, Greiner’s red tape crisis, the steepest single cliff that lies ahead in the funnel, is the moment a founder-led firm must become a delegated institution. It sits squarely inside the LMM (Lower Middle Market) target zone.
- Each glass ceiling triggers a distinct advisor-demand pattern. Accountants and coaches dominate the leadership crisis; fractional CFOs and org-design consultants dominate the autonomy crisis; M&A advisors and exit planners dominate the red-tape wall.
- AI is now reshaping the inputs to each glass ceiling. The Maister work-type progression from Brains to Grey Hair to Procedure which historically played out over years now now compresses significantly on AI-enabled work-types, and the pyramid leverage model is collapsing into what HBR calls “the obelisk” (Duncan, Anderson & Saviano, 2025).
- The strategic implication: an owner-managed advisory firm’s exit value is determined less by its current revenue than by which crisis it has already survived. Founders systematically over-value scope and under-value patience.
The math nobody puts on the slide
Every owner-managed advisor we have ever met believes their firm is on a trajectory. The trajectory is real. The trajectory is also brutally improbable.
We pooled the most recent US Census Bureau’s 2022 County Business Patterns and 2022 Economic Census (released April 2025, DRB approval CBDRB-FY25-0227) with UK Office for National Statistics firm-size distribution (UK Business: Activity, Size and Location, 2022, Table 9). We restricted the universe to tech-enabled advisory and professional-service codes - NAICS 541511, 541512, 5416xx, 541620 and 541690 in the US; SIC 6201, 6202, 6920, 7022 and 7112 in the UK. The combined sample is 677,019 firms (US 308,889; UK 368,130). The result, expressed as the share of firms above each successive revenue threshold conditional on being above the prior one, looks like this:
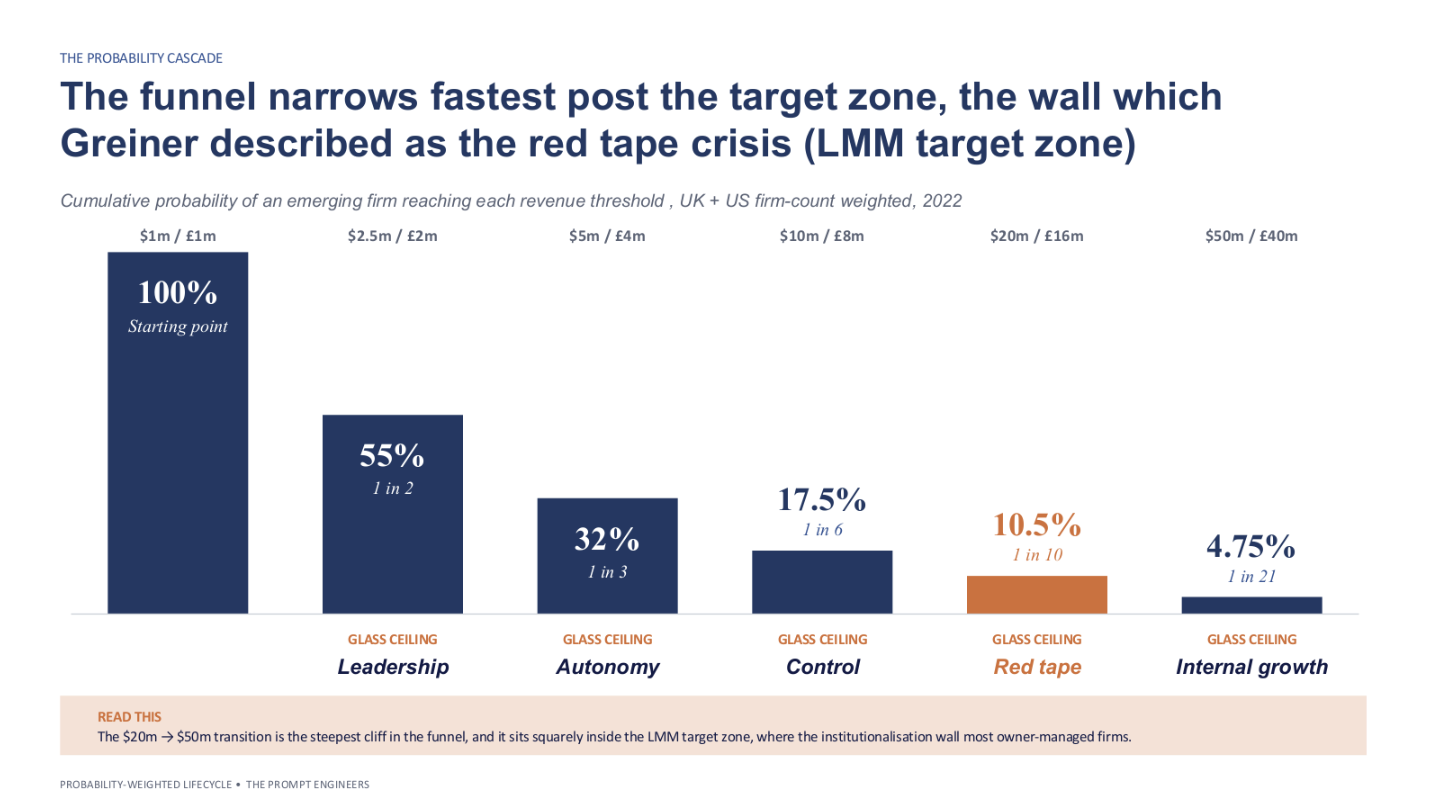
The funnel is geometric. Each doubling of revenue roughly halves the surviving share. The transition from $20m to $50m where the cumulative share falls from 10.5% to 4.75%, a ~55% relative drop in a single revenue doubling is the steepest single cliff. It is also, not coincidentally, the boundary after which a firm becomes an institution by crossing the wall or Greiner’s red tape crisis. We will return to why.
One clarification on what this measure is and is not. These are cross-sectional shares of the live firm population at a point in time not the tracked survival of a single cohort over decades. We use the language of “probability” and “survival” because it is intuitively how founders and advisors read the funnel, but the strict claim is about prevalence: for every 100 firms above $1m, this is how many sit above each higher threshold today. We address the obvious follow-up, does the funnel hold up over time and in real terms? in the appendix; the short answer is yes.
This funnel is not specific to one country or to a single year. The UK and US cumulative shares sit within roughly two percentage points of each other at every threshold from $5m upward. Re-running the same UK analysis with 2025 ONS data, every threshold is slightly higher in 2025 than in 2022, by between ~0.5 and ~4 percentage points, which is what inflation would produce, with the larger nominal shifts at the lower thresholds where firm-population density is highest. Whatever explains the funnel is not regulatory, fiscal, or tax-driven; it is structural.
It is also not new. Four independent thinkers across six decades have described it.
Four observers, one pattern
In 1959 the economist Edith Penrose published The Theory of the Growth of the Firm.Her central argument, for which the book has become one of the most-cited works in management economics, was that firms are not bundles of products or technologies but bundles of managerial services. Growth is constrained not by market opportunity, but by the rate at which managers internal to the firm can absorb new responsibilities.
…if a firm deliberately or inadvertently expands its organization more rapidly than the individuals in the expanding organization can obtain the experience … necessary for the effective operation of the group, the efficiency of the firm will suffer … and a period of ‘stagnation’ may follow.
Edith Penrose, The Theory of the Growth of the Firm, 1959 (Chapter IV, "Expansion Without Merger," p. 43 of the 2009 Oxford 4th edn)
The mechanism Penrose described was later given two near-synonymous labels in the subsequent literature: the Penrose effect (Hay & Morris, 1991) and the Penrose theorem (Marris, 1964).
This is the mechanism that underlies the funnel.
Thirteen years later, in 1972, Larry Greiner’s Evolution and Revolution as Organizations Grow appeared in HBR. Greiner observed that firms move through evolutionary phases of relative calm, each terminating in a revolutionary crisis. He named five crises in his 1972 article, leadership, autonomy, control, red tape, and a fifth one which he drew as “?”. In his 1998 HBR revision, Greiner explicitly walked back an earlier guess (“psychological saturation”) and settled on the crisis of internal-growth limits: the point at which an organisation realises further growth requires looking outside itself, to alliances, acquisitions, or a sale. The same 1998 revision noted that his original framework had been built on industrial and consumer goods companies, but that subsequent study of "a number of consulting, law, and investment firms" confirmed the same evolution-and-revolution pattern in professional service firms, the category of firm this article is concerned with. Each crisis arises because the management practice that produced growth in one phase becomes the impediment to growth in the next.
In 1983 Neil Churchill and Virginia Lewis adapted the framework for owner-managed firms in their HBR paper The Five Stages of Small Business Growth. They mapped Greiner’s revolutions onto Existence → Survival → Success → Take-off → Resource Maturity, the exact terminology owner-managed advisory firms still recognise. Their framework was built explicitly around founder identity, family ownership, and the economics of small professional service firms.
Then in 1993 David Maister, in Managing the Professional Service Firm, translated the same lifecycle into the economics of professional services specifically. His Brains / Grey Hair / Procedure projects typology (Chapter 1) described three modes of client work, each with its own pitch to the client. Brains projects are sold on raw expertise, Maister sums up the pitch as “Hire us because we’re smart” with one-off engagements and a low ratio of junior to senior time. Grey Hair projects are sold on the firm’s experience with similar problems before, allowing repeatable methodology and the use of more juniors. Procedure projects are sold on efficiency and reliable execution of familiar work, with the highest junior-to-senior ratios and the most programmable workflows. Chapter 2 of the same book, The Professional Firm Life Cycle, argues that practice areas naturally migrate along this spectrum from Brains toward Procedure as their problems become more familiar and more codifiable.
Four observers. Four vocabularies. One pattern. Population-level firm-count studies exist but, to our knowledge, the 2022 synthesis is the first to anchor all four traditions to a common set of revenue thresholds.
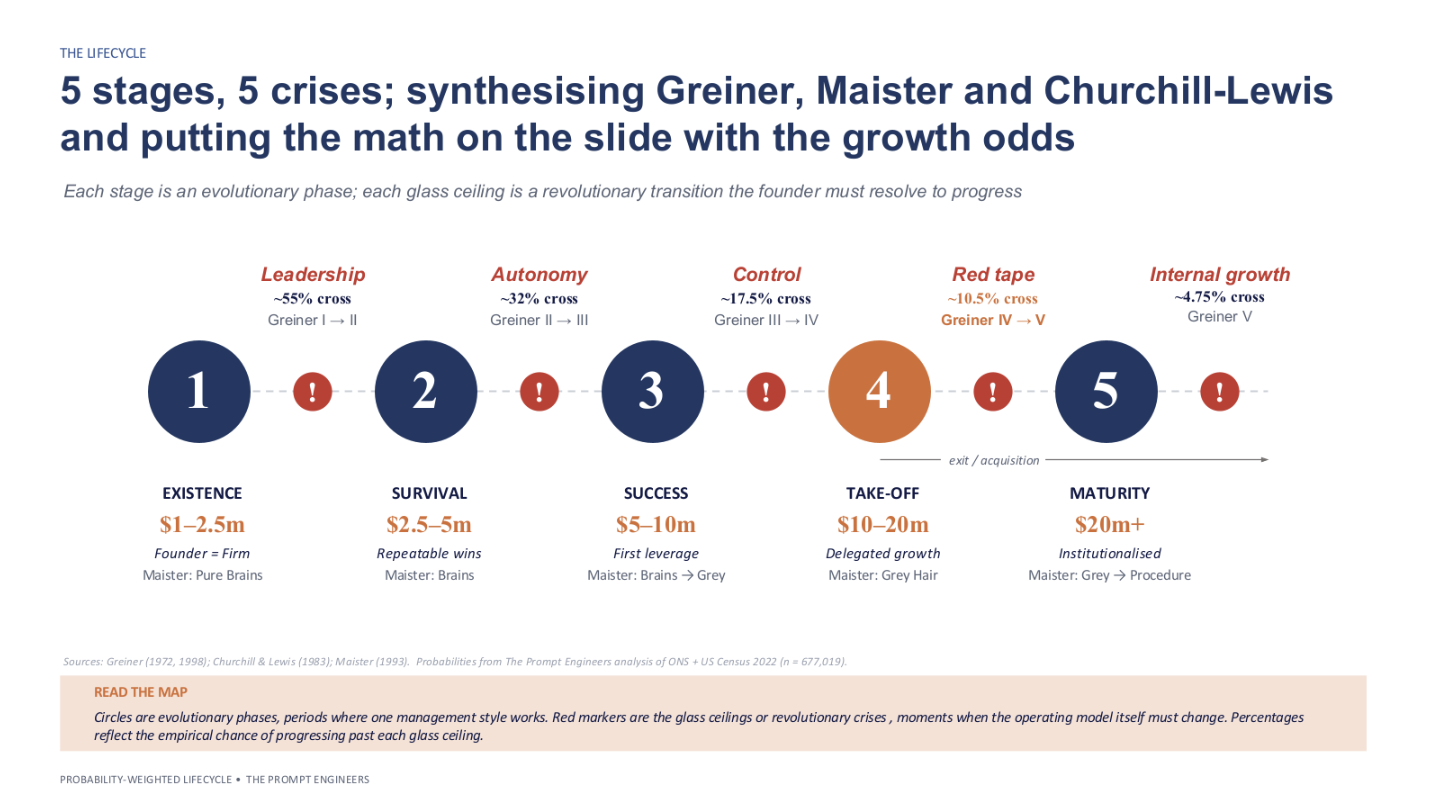
The schematic is the canonical model. Five stages, Existence ($1–$2.5m), Survival ($2.5–5m), Success ($5–10m), Take-off ($10–20m), Resource Maturity ($20m+), separated by Greiner’s five revolutionary crises: leadership at the $2.5m ceiling, autonomy at $5m, control at $10m, red tape at $20m, and the internal-growth crisis at $50m. The percentages reflect the cross-sectional thinning of the firm population at each glass ceiling.
Five stages, five different firms
Scope. This analysis covers professional-services firms in SaaS and tech-enabled consulting (selected UK SIC and US NAICS classifications covering software development, computer consultancy, accounting, management consultancy, etc.). Revenue thresholds and the breakthrough probabilities behind them are sector-specific; the same numbers should not be transposed onto other industries without recalibration. The empirical floor is $1m, matching Churchill and Lewis’s original sample of $1m–$35m firms (n=83 responses, 110 firms surveyed) and the resolution of both data sources used here. Firms below $1m exist in much larger numbers but sit beneath the analytical resolution of the framework.
A note on Churchill–Lewis and revenue. Churchill and Lewis explicitly resist defining their stages by sales alone, their composite is value-added, geographic dispersion, and product/technology complexity, and they cite the example of a $10m fast-tech firm being “bigger” than a $20m liquor wholesaler. Within a single industry cluster, that objection carries considerably less weight: revenue becomes a workable proxy for the underlying composite. The thresholds below should still be read as transition pressure points, the points at which the management factors in Churchill and Lewis’s Exhibit 5 typically shift, rather than as hard stage definitions.
The defining feature of the model is that each stage is, operationally, a different firm. Not a bigger version of the previous firm, a different one.
Stage 1: Existence ($1m–$2.5m), Greiner Phase 1: Creativity / Entrepreneurial
In the existence stage, the founder is the firm. Revenue is generated through founder relationships, founder delivery, founder credibility. The work is pure Brains in Maister’s typology, every engagement one-of-a-kind, bespoke, requiring the most senior person; in an owner-managed firm at this scale, that person is the founder. Leverage is minimal: a bookkeeper, an assistant, perhaps one junior. Cash flow is fragile. The first hire is a high-stakes bet.
The transition out of existence, Greiner’s leadership crisis, is failed by roughly half of all firms. Of every two firms that reach $1m, one will fail to cross $2.5m. The proximate causes are predictable: cash flow fragility, a failed first hire that consumes the year’s surplus, no repeatable delivery methodology, founder personal capacity exhausted before the firm achieves enough scale to fund a second tier of delivery talent.
Stage 2: Survival ($2.5m–$5m), Greiner Phase 2: Direction / Focus on one major service
Surviving firms enter Greiner’s “direction” phase. The founder, who has now hired functional managers, must direct rather than do. The work is still predominantly Brains, but the firm begins to develop replicable methodologies for core service offerings. Cash flow is still tight but no longer existential; the firm has working capital for the first time.
The autonomy crisis, the transition from $2.5m to $5m, is failed by roughly two of three survivors. By the autonomy crisis, only 32 of every 100 firms that started at $1m remain above the $5m line. Functional managers exist but the founder will not let go. Decisions queue at the founder’s desk. The most talented of the second-tier managers, recognising that their growth is blocked, leave. The firm stalls because its operating model cannot evolve from “founder delegates tasks” to “managers make decisions.” Lippitt and Schmidt (1967), writing on developmental crises, identified the underlying mechanism: this is not only a structural problem but an identity one, a question of what the founder is willing to sacrifice of their personal centrality.
Stage 3: Success ($5m–$10m), Greiner Phase 3: Delegation / Geographic or service expansion
Firms that survive both crises arrive at Success, Churchill and Lewis’s third stage. The firm has the structural option of remaining stable and profitable (Success-Disengagement, in their terminology) or pushing for growth (Success-Growth). Many founders choose Disengagement, either explicitly or by failing to make the decision at all. The firm becomes a comfortable, high-cash-flow lifestyle business.
For those who push for growth, the control crisis, the $5m to $10m transition, is the most insidious. Delegated managers, finally empowered, go their own way. Pricing drifts. Quality drifts. Practice leaders run silos. The firm requires a second-line management infrastructure, controller, head of HR, head of operations, that did not exist before. By the time a firm clears this glass ceiling, only 17.5% of those that started at $1m are still in the funnel, roughly 1 in 6.
Stage 4, Take-off ($10m–$20m), Greiner Phase 4: Coordination / Institutionalisation
The Take-off stage requires the firm to function as a genuinely delegated institution. The founder, if still operating, must be a chairman or CEO, not a senior practitioner. The firm needs governance, audit-grade reporting, formal succession planning, and a sales engine that runs without the founder personally closing deals. The work-mix has shifted from predominantly Brains to predominantly Grey Hair.
Nine out of ten firms that embark on the growth journey fail to make this transition. The population share falls from 17.5% to 10.5% across this one revenue doubling. Institutionalisation kills speed; speed loss kills morale; morale loss costs the talented operators who held the firm together through Stages 2 and 3. This is Greiner’s red tape crisis, the wall at which formal planning, capital review, and centralised staff functions become indispensable, while their own bureaucratic downside has not yet had time to emerge. Many firms exit at this point, either as a planned trade sale or, more commonly, by simply ceasing to grow.
Stage 5, Resource Maturity ($20m+), Greiner Phase 5: Collaboration
Firms that cross the wall enter Resource Maturity. They are now institutions in the technical sense: the operating model can survive the loss of any individual including the founder. They face another ceiling at roughly $50m, Greiner’s crisis of internal-growth limits, the point at which the organisation realises there is no internal solution for further growth and must look outward to acquisitions, alliances, or a sale. Only 1 in 21 firms that started at $1m ever cross this ceiling. Those that do operate in an entirely different competitive context.
Why the funnel exists
The crises Greiner named are symptoms. The empirically confirmed Penrose effect is the mechanism that underlies the funnel: each crisis is a moment at which the firm has attempted to grow faster than its internal pool of managerial capacity can absorb.
This matters because it implies the binding constraint on growth is internal, not market opportunity, not capital availability, not competition. The adjacent markets are expanding rapidly: global software consulting is projected to grow at 16% CAGR through 2031, and digital transformation consulting at 13%, both well ahead of the broader management consulting market at 4.7% (Mordor Intelligence). Underlying enterprise demand tracks this, with the global SaaS market expanding at 12% CAGR to reach $819bn by 2030 (Grand View Research). Capital has been abundant. Competition in the LMM segment is fragmented. Yet the funnel persists.
The reason is that managerial capacity cannot be bought one-for-one from the external market. Penrose’s argument runs in two steps. First, externally hired managers cannot immediately substitute for experienced insiders, because the value of an existing manager lies as much in the working relationships and firm-specific knowledge they have built up over time as in their formal skills, and that contextual knowledge takes time to acquire. Second, because new hires require existing managers’ attention to be inducted and integrated, the existing managerial group itself sets a hard ceiling, what Penrose called “a fundamental and inescapable limit” (Chapter IV, p. 44), on how much the firm can expand in any given period. The 12–24 months it typically takes a senior hire to become fully effective in a new firm, a practical estimate, not a Penrose figure, is the modern correlate. When growth requires the firm to roughly double headcount between revenue thresholds, this absorption ceiling bites. Subsequent empirical work (Shen 1970; Tan & Mahoney 2005, 2007; Kor & Mahoney 2000) has confirmed the Penrose effect across multiple datasets and industries. Operating at the population level, it predicts exactly the funnel we observe.
This insight is what makes the lifecycle so resistant to short-cuts. Capital alone does not fix it; private equity injected into a firm that has not survived the autonomy crisis does not fast-forward it through the control crisis. Hiring senior people from outside does not fix it; they lack the internal context to be effective until they have absorbed it. There is no purchasable substitute for organisational maturity.
Each glass ceiling is a buying moment
For the advisor, the crucial insight is that each glass ceiling triggers a distinct pattern of external help-seeking. Founders rarely understand which ceiling they are hitting. They consistently buy the wrong help, from the wrong advisors, until the crisis is acute enough that they buy from someone with the specific expertise the moment requires.
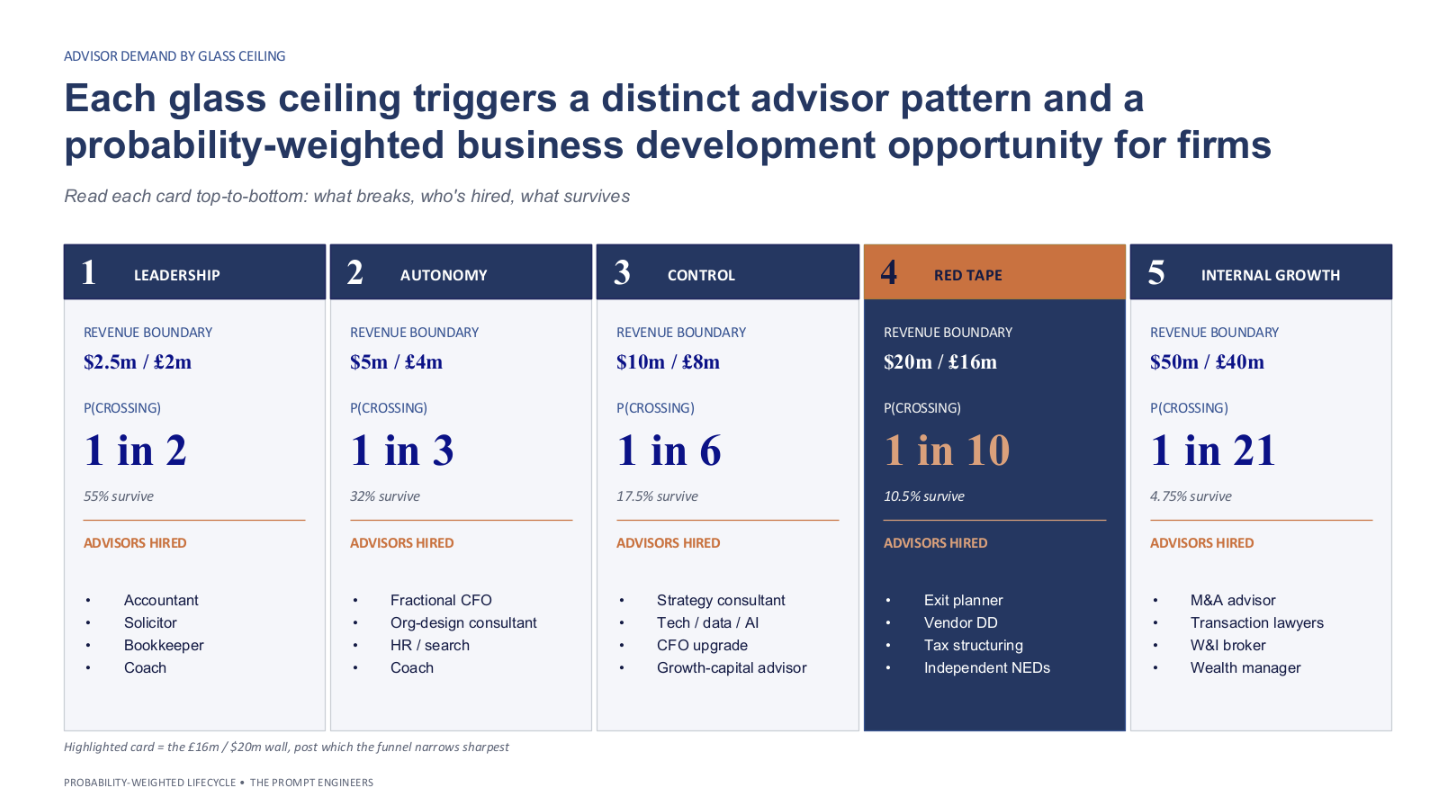
At the leadership crisis, founders hire accountants, solicitors, bookkeepers, and (increasingly) executive coaches. These are mostly compliance and process-of-thought purchases. The advisor’s economic capture is small, typical fee bands run from £2–10k ($2.5–12k) a month for a coach, low five-figures for accountancy. But the relationship is foundational; founders rarely change these advisors as the firm grows, which is why incumbent accountants and lawyers continue to capture work the firm has long outgrown.
At the autonomy crisis, the demand pattern shifts decisively to fractional CFOs, org-design consultants, head of HR/search, and continued executive coaching. The founder has finally accepted that the firm needs structural help, not just task help. Fees rise sharply, £3–10k ($4–12k) a month for a fractional CFO, £25–80k ($35–105k) for an org redesign engagement, retained search fees of 25–30% on senior hires that now cost £150k+ ($200k+).
At the control crisis, the demand pattern shifts again. The firm is now buying strategy consulting, tech/data/AI capability, an upgrade of the CFO function from fractional to full-time, and, for the first time, growth-capital advisors. The fee bands escalate dramatically. A strategy review from a boutique can run £75–250k ($100–350k). A tech and AI enablement engagement can run £100k+($120k). Total advisor spend at a $10m firm crossing the control crisis is often equivalent to 6–10% of revenue.
At the red tape crisis, the institutionalisation wall, the demand pattern shifts to exit planning. Exit planners, vendor due diligence, tax structuring, independent non-executive directors. The founder is now contemplating, or being forced to contemplate, what the firm is worth and what it would take to sell it. Fee economics are radically different: success fees of 2–5% on transaction value, retainers of £20–50k ($25–65k) a month, vendor DD packages of £150–500k ($200–650k).
At the internal-growth crisis, the rare 1-in-21 transition to $50m, demand is dominated by M&A advisors, transaction lawyers, W&I (warranty and indemnity) brokers, and wealth managers for the founder’s post-transaction wealth.
The total addressable advisor fee pool is not evenly distributed across the funnel. In our experience, roughly 70% of the lifetime advisor fees a firm will ever pay are paid in the last 18 months of its independent existence, at and around the institutionalisation wall. This is why the LMM exit-advisor market is intensely competitive and why pre-emptive positioning at the start of the Take-off stage is the highest-leverage move an advisor can make.
The total addressable advisor fee pool is not evenly distributed across the funnel. Roughly 70% of the lifetime advisor fees a firm will ever pay are paid in the last 18 months of its independent existence — at and around the Red Tape wall. This is why the LMM exit-advisor market is intensely competitive and why pre-emptive positioning at the start of the Take-off stage is the highest-leverage move an advisor can make.
Fee bands throughout this section are author estimates from advisor-market practice.
What AI changes
The empirical picture is unambiguous. OECD data on firms with 10 or more employees, refreshed in May 2026, shows the all-sector average AI usage rate rising from 5.6% in 2020 to 20.2% in 2025. Within the two sectors that contain the firms this article is about, the rise is steeper. Information and Communication moved from 14% to 57% over five years. Professional, Scientific and Technical activities moved from 13% in 2021 to 37% in 2025. The advisory population is not an average AI adopter. It runs at roughly two to three times the OECD mean, and the curve is still bending upward. The lifecycle Maister and Greiner described took 15–25 years to traverse from $1m to $20m+ for the firms that succeeded. The 2022 firm-count data still shows that broad timing. AI is now reshaping the inputs to it. Three things are happening simultaneously, and a fourth is, on our reading, not happening.
First, the kind of work shifts faster. Maister observed that practice areas naturally migrate from Brains to Grey Hair to Procedure as they mature: work that was bespoke a decade ago becomes routine today, and routine work becomes commoditised (Managing the Professional Service Firm, 1993, Chapter 2). He framed this as a multi-year evolution. Generative AI compresses that evolution dramatically, commoditising whole categories of Grey Hair work (market analysis, due diligence, contract review, financial modelling, business writing) into Procedure-level efficiency in months rather than years. This is good news for clients and bad news for any advisory firm whose competitive moat sits in Grey Hair territory without a continuous refresh into new Brains domains. The UK data shows the compression already happening. Between September 2023 and December 2025, the share of UK Professional and Business Services firms using LLMs for text generation rose from 7% to 25% (ONS BICS Wave 147). Total AI usage in the sector rose from 17% to 43% over the same 27 months. The work LLMs do well, drafting, research, first-pass analysis, summarisation, is the Grey Hair work that used to fill the chargeable middle tier of an advisory firm. It is being repriced in months, not years.
Second, the shape of the firm changes. Harvard Business Review’s September 2025 piece AI Is Changing the Structure of Consulting Firms (Duncan, Anderson & Saviano) documents what the authors call the “obelisk”, a firm shape with fewer junior layers, smaller teams, senior-heavy delivery augmented by AI facilitators and engagement architects. The traditional pyramid leverage economics that funded the P&L of larger firms, many juniors leveraged off few partners, is structurally weakened. Greiner’s autonomy and control crises arrive earlier and harder, because the manager-of-managers tier never gets fully built. The UK data tracks the same pattern. Over 40% of UK Professional and Business Services firms now use some form of AI, and another 37% plan to adopt within the next three months (ONS BICS Wave 147). The technologies driving that adoption, LLMs, machine-learning data processing, image processing, visual content tools, are precisely the technologies that substitute for the analytical and production work juniors used to do. The obelisk is not a future prediction. The tier the pyramid leveraged is already eroding.
Third, the pricing model shifts. McKinsey's UK managing partner Michael Birshan disclosed in November 2025 that about a quarter of McKinsey's global fees now come from outcomes-based pricing rather than time-based billing, a notable departure from the billable-hours model that has defined consulting (TheStreet/Business Insider). Bain & Company has similarly disclosed that tech- and AI-enabled revenue now accounts for roughly 30% of the firm's business, with leadership projecting that share to reach 50% within years. Bain's own New Growth Equation for Tech Services (November 2025) warns that firms continuing with business-as-usual pricing risk eroding revenue by 30% or more and losing 5-7 points of EBIT margin to deal discounting. Yet Thomson Reuters Institute's research finds that as much as 90% of corporate legal spend on outside law firms still flows through hourly rates. The tension is structural: AI makes work faster, but professional-firm revenue models depend on hours billed. The fastest-moving firms are restructuring around outcomes; the slowest face the gradient pulling against them.
What is not happening, on our reading, is a compression of the Penrose ceiling itself. AI can substitute for several of the resource constraints Churchill and Lewis catalogued, cash for some systems, time for certain analytical workflows, even some functional headcount. It can partly mask the identity dimension Lippitt and Schmidt described, by making the founder feel structurally more capable than the underlying organisation is. But the binding constraint Penrose named, the rate at which managers can absorb firm-specific experience and exercise tacit judgement, is not, on present evidence, compressible by AI.
The combined effect is to amplify the funnel, not soften it: AI is decoupling revenue growth from organisational readiness. Firms reach revenue thresholds faster than their managerial capacity can mature; the funnel does not soften; the cliffs arrive faster and with less warning. The 1-in-21 figure for $50m is, on present trajectory, likely to fall toward 1-in-30 or worse over the next five years. (This is a forward-looking projection grounded in the AI adoption trends and Penrose ceiling argument above, rather than a measured outcome, firm-level panel data linking AI adoption to threshold-crossing does not yet exist.)
What this means for advisors
Five practical implications for advisors operating in the LMM tech-enabled advisory market.
One: name the stage before selling the service. The single most common mistake we observe in advisory positioning is selling Stage 4 services to a Stage 2 firm, or Stage 1 services to a Stage 3 firm. Founders rarely know which stage they are in. Naming it, accurately and unprompted, is the most powerful credibility signal an advisor can offer. A diagnostic, a maturity assessment, or a productised audit that returns the founder a credible picture of where the firm actually sits is worth more, commercially, than the service that follows.
Two: sell against the next glass ceiling, not the next stage. Founders do not buy stage labels. They recognise glass ceilings, pain, disorder, talent loss, margin compression, long before they recognise the abstract phase they are in. Frame the offering around “when your delegation crisis hits, here is what we do” rather than “when you reach the Take-off stage, you’ll need…”.
Three: concentrate business development on the $20-50m bridge. This is the steepest relative cliff in the funnel and the firms in that transition are simultaneously at peak advisor receptivity and peak willingness to pay for outcome-based fees. This is the highest-yield zone for any advisor whose practice extends across multiple stages.
Four: build pods, not point engagements. A coordinated pod of fractional CFO + tax + legal + coach across Stages 2–4 captures multi-crisis fee value, with the same client, over 5–8 years. Point engagements at the exit point are higher per-fee but lower probability of conversion and much shorter relationship arcs. The economics favour pods.
Five: re-baseline the serviceable addressable market. The real serviceable market in the UK + US LMM advisory segment is not the 677,019-firm population. We position our serviceable market as firms above approximately $8m revenue, the segment that has cleared the leadership and autonomy crises and is approaching the $1–20m EBITDA target zone where advisor fees concentrate. Capacity plans, BD plans, and partner economics should be sized to that segment, not to the full addressable-firm count that public-domain reports cite.
tures multi-crisis fee value, with the same client, over 5–8 years. Point engagements at the exit point are higher per-fee but lower probability of conversion and much shorter relationship arcs. The economics favour pods.
Five: re-baseline the serviceable addressable market. TPE's real serviceable market in the UK + US LMM advisory segment is not the 582,000-firm population. It is the roughly 7,200 firms above $8m revenue across the UK and US, of which only the ~1,900 UK and ~5,300 US firms sit in the $1–20m EBITDA target zone. Capacity plans, BD plans, and partner economics should be sized to that number — not to the addressable-firm count that the public-domain reports cite.
A note on method
The funnel data in this article is empirical and reproducible. The frameworks, Penrose, Greiner, Churchill-Lewis, Maister, with Lippitt-Schmidt at the autonomy step, are interpretive lenses; we use them to explain the data, not the other way around. The crisis labels and stage names are not unique to this analysis; they are the canonical vocabulary of six decades of professional service firm literature.
Three caveats worth being explicit about.
First, the measure is cross-sectional. The shares reported above describe the live firm population at a point in time, not the tracked progression of a single cohort over decades. The interpretation as “probability of breaking through” is intuitive and, we believe, defensible, but it is a population-prevalence measure, not a longitudinal one. Cohort-tracked panel data would test the same proposition more strictly; that work, to our knowledge, has not been done at this resolution for the tech-enabled advisory segment.
Second, stage-of-growth theories have been challenged empirically, notably by Levie and Lichtenstein (2010) and Phelps, Adams and Bessant (2007), for over-specifying a deterministic sequence that real firms rarely follow tidily. We agree with the criticism and apply the frameworks as interpretive maps rather than predictive models. The funnel data is the spine; the stage labels are the joints.
Third, the probabilities cited are population-level, not deterministic predictions for any individual firm. Any individual firm with a brilliant founder, a defensible niche, and aligned capital can do considerably better than the conditional average. The funnel describes the population, not the exception.
A robustness check on the funnel’s stability, re-running the UK numbers in 2025 and adjusting for inflation back into 2022 real pounds, is reported in the appendix. Headline finding: every threshold from £5m upward moves by less than half a percentage point in real terms. The difficulty structure is a stable feature of the firm population.
Sources and citations
Empirical data
- Office for National Statistics, UK Business: Activity, Size and Location 2022, Table 9. (Also 2025 release, used for the appendix robustness check.)
- US Census Bureau, 2022 County Business Patterns and 2022 Economic Census, released April 2025 (DRB approval CBDRB-FY25-0227).
- ONS Business Insights and Conditions Survey (BICS), Wave 147 (2025), AI adoption by sector.
- OECD, AI Adoption by Small and Medium-Sized Enterprises, December 2025.
Theoretical foundations
- Penrose, E. (1959/2009). The Theory of the Growth of the Firm. Fourth edition with a new introduction by Christos N. Pitelis. Oxford: Oxford University Press. Direct quotations in this article are cited to chapter and page of the 2009 reissue.
- Greiner, L. E. (1972, revised 1998). “Evolution and Revolution as Organizations Grow.” Harvard Business Review.
- Churchill, N. C. & Lewis, V. L. (1983). “The Five Stages of Small Business Growth.” Harvard Business Review, May–June.
- Lippitt, G. L. & Schmidt, W. H. (1967). “Crises in a Developing Organization.” Harvard Business Review, November.
- Maister, D. H. (1993). Managing the Professional Service Firm. New York: Free Press.
- Kor, Y. Y., Mahoney, J. T., Siemsen, E. & Tan, D. (2016). “Penrose’s The Theory of the Growth of the Firm: An Exemplar of Engaged Scholarship.” Production and Operations Management, 25(10): 1727–1744.
Market growth
- Mordor Intelligence (2026). Management Consulting Services Market Size & Share Analysis – Growth Trends and Forecast (2026–2031). URL: mordorintelligence.com/industry-reports/management-consulting-services-market.
- Grand View Research (2025). Software As A Service Market Size, Share & Trends Analysis Report, 2025–2030. Report ID: GVR-4-68039-940-5. URL: grandviewresearch.com/industry-analysis/saas-market-report.
- Mordor Intelligence (2026). Software Consulting Market Size & Share Analysis – Growth Trends and Forecast (2026–2031). URL: mordorintelligence.com/industry-reports/software-consulting-market.
AI inflection
- Duncan, D. S., Anderson, T. & Saviano, J. (2025). “AI Is Changing the Structure of Consulting Firms.” Harvard Business Review, September 2025. URL: hbr.org/2025/09/ai-is-changing-the-structure-of-consulting-firms.
- McKinsey & Company (2025). Statement by Michael Birshan, UK managing partner, London media briefing November 2025. Reported by Business Insider; cited via Hunt Scanlon Media, "McKinsey Continues to Deliver Value; It Just Charges Differently for it Now," 8 December 2025. URL: https://huntscanlon.com/mckinsey-continues-to-deliver-value-it-just-charges-differently-for-it-now.
- Bain & Company (2025). "Business-as-usual could erase 30% of revenue for tech services firms, Bain & Co finds." Press release, 18 November 2025. URL: https://www.bain.com/about/media-center/press-releases/20252/business-as-usual-could-erase-30-of-revenue-for-tech-services-firms-bain--co-finds.
- Thomson Reuters Institute (2025). "Future of Professionals report analysis: Why AI will flip law firm economics." November 2025. URL: https://www.thomsonreuters.com/en-us/posts/legal/future-of-professionals-report-analysis-law-firm-economics.
- Thomson Reuters (2025). Future of Professionals Report 2025. Third annual edition. URL: https://www.thomsonreuters.com/content/dam/ewp-m/documents/thomsonreuters/en/pdf/reports/future-of-professionals-report-2025.pdf.
Empirical caveats
- Levie, J. & Lichtenstein, B. B. (2010). “A Terminal Assessment of Stages Theory: Introducing a Dynamic States Approach to Entrepreneurship.” Entrepreneurship Theory and Practice, 34(2): 317–350.
- Phelps, R., Adams, R. & Bessant, J. (2007). “Life cycles of growing organisations: A review with implications for knowledge and learning.” International Journal of Management Reviews, 9(1): 1–30.
- Shen, T. Y. (1970). “Economies of scale, Penrose-effect, growth of plants and their size distribution.” Journal of Political Economy, 78(4): 702–716.
- Tan, D. & Mahoney, J. T. (2005, 2007). Empirical tests of the Penrose effect in international business contexts. Managerial and Decision Economics and Management International Review.
- Office for National Statistics (2026). "CPI INDEX 00: ALL ITEMS 2015=100." Series D7BT, Consumer Price Inflation time series (MM23). Released 20 May 2026. URL: https://www.ons.gov.uk/economy/inflationandpriceindices/timeseries/d7bt/mm23

The Future of Consulting: How AI-Enabled Assessments Drive Transformation

The Art and Science of AI Enhanced Consulting: Balancing Technology and Human Insight
.jpeg)
Streamlining Strategy: The Impact of AI on Consulting Models