Breaking the glass ceiling: why only 1 in 22 owner-managed advisory firms ever cross $50m revenue
.webp)

In brief
- Of every 100 owner-managed tech-enabled advisory firms that reach $1m revenue, only 54 cross $2.5m, only 31 cross $5m, only 17 cross $10m, only 10 cross $20m, and only 4 or 5 ever reach $50m.
- This pattern is not random. It is the precise empirical signature of the lifecycle described independently by Larry Greiner (1972), Neil Churchill and Virginia Lewis (1983), and David Maister (1993) — and explained mechanically by Edith Penrose's 1959 theory of the firm.
- Each transition from one stage to the next is a discrete crisis with a measurable mortality rate. The $10m → $20m wall — Greiner's "crisis of red tape" — is the steepest, and it sits squarely inside the LMM target zone.
- Each crisis triggers a distinct advisor demand pattern. Accountants and coaches dominate the leadership crisis; fractional CFOs and org-design consultants dominate the autonomy crisis; M&A advisors and exit planners dominate the red-tape wall.
- AI is now compressing this lifecycle. What Maister observed as a 5–10 year evolution from Brains → Grey Hair → Procedure now plays out in 12–18 months, and the pyramid leverage model is collapsing into what HBR calls "the obelisk."
- The strategic implication: an owner-managed advisory firm's exit value is determined not by its current revenue, but by which crisis it has already survived. Founders systematically over-value scope and under-value patience.
The math nobody puts on the slide
Every owner-managed advisor we have ever met believes their firm is on a trajectory. The trajectory is real. The trajectory is also brutally improbable.
We pooled the most recent UK Office for National Statistics firm-size distribution (Business Activity, Size and Location, 2022, Table 9) with the US Census Bureau's 2022 Business Patterns release. We restricted the universe to tech-enabled advisory and professional-service codes — SIC 6202, 6920, 7022 and 7112 in the UK; NAICS 541512, 5416xx, 541620 and 541690 in the US. The combined sample is 582,761 firms. The result, expressed as the cumulative probability that an emergent firm at $1m revenue ever crosses each successive threshold, looks like this:

The funnel is geometric. Each doubling of revenue roughly halves the survivor cohort. The transition that drops survivors from 16.8% to 10.1% — from $10m to $20m revenue — is the steepest single cliff. It is also, not coincidentally, the boundary at which an owner-managed firm becomes an institution. We will return to why.
This funnel is not specific to any one country, sector, or business cycle. The UK and US conditional probabilities sit within two percentage points of each other at every threshold above $4m. Geographic variation that exists below $4m disappears above it. Whatever explains the funnel is not regulatory, fiscal, or tax-driven; it is structural.
It is also not new. Four independent thinkers across six decades have described it.
Four observers, one pattern
In 1959 the economist Edith Penrose published The Theory of the Growth of the Firm. Her central argument — for which the book has been cited more than 50,000 times — was that firms are not bundles of products or technologies but bundles of managerial services. Growth is constrained not by market opportunity, but by the rate at which managers internal to the firm can absorb new responsibilities.
If a firm expands its organisation more rapidly than the individuals in it can obtain the experience necessary for the effective operation of the group, the efficiency of the firm will suffer and a period of stagnation may follow.
Edith Penrose, The Theory of the Growth of the Firm, 1959
This phenomenon — the empirically confirmed "Penrose effect" — is the mechanism that underlies the funnel.
Thirteen years later, in 1972, Larry Greiner's Evolution and Revolution as Organizations Grow appeared in HBR. Greiner observed that firms move through evolutionary phases of relative calm, each of which terminates in a revolutionary crisis. He named five crises in his original article — leadership, autonomy, control, red tape, and a fifth (later expanded into a sixth in his 1998 revision). Each crisis arises because the management practice that produced growth in one phase becomes the impediment to growth in the next.
In 1983 Neil Churchill and Virginia Lewis adapted the framework specifically for owner-managed firms in their HBR paper The Five Stages of Small Business Growth. They mapped Greiner's revolutions onto Existence → Survival → Success → Take-off → Resource Maturity — the exact terminology owner-managed advisory firms still recognise. Their framework was built explicitly around founder identity, family ownership, and the economics of small professional service firms.
Then in 1993 David Maister, in Managing the Professional Service Firm, took the same lifecycle and translated it into the economics of the professional service firm specifically. His Brains / Grey Hair / Procedure typology described how the kind of work a firm does shifts as it matures, and how leverage economics — the ratio of junior to senior staff — must shift with it. Each work-type maps to a stage. Brains practices are pure expertise — bespoke, founder-delivered, low-leverage. Grey Hair practices are experience-based, with replicable methodology and modest leverage. Procedure practices are efficiency-based, with high leverage and codified workflows.
Four observers. Four vocabularies. One pattern. And the 2022 firm-count data is precisely the population-level evidence of what they were each describing.

The schematic above is the canonical model. Five stages — Existence (under $1m), Survival ($1–2.5m), Success ($2.5–10m), Take-off ($10–20m), Resource Maturity ($20–50m+) — separated by four crises. The percentages reflect the empirical mortality at each transition. The fourth crisis — Red Tape, at the $10–20m wall — is the worst.
Five stages, five different firms
The defining feature of the model is that each stage is, operationally, a different firm. Not a bigger version of the previous firm — a different one.
Stage 1 — Existence (under $1m)
In the existence stage, the founder is the firm. Revenue is generated through founder relationships, founder delivery, founder credibility. The work is pure Brains in Maister's typology — every engagement is bespoke, customised to the client, delivered by the founder personally. Leverage is minimal: there may be a bookkeeper, an assistant, perhaps one junior. Cash flow is fragile. The first hire is a high-stakes bet.
The transition out of existence — the leadership crisis — is failed by roughly half of all firms. Of every two firms that reach $1m, one will fail to cross $2.5m. The proximate causes are predictable: cash flow fragility, a failed first hire that consumes the year's surplus, an absence of repeatable delivery methodology, founder personal capacity exhausted before the firm achieves enough scale to fund a second tier of delivery talent.
Stage 2 — Survival ($1–2.5m)
Surviving firms enter Greiner's "direction" phase. The founder, who has now hired functional managers, must direct rather than do. The work is still predominantly Brains, but the firm begins to develop replicable methodologies for the core service offerings. Cash flow is still tight but no longer existential; the firm has working capital for the first time.
The autonomy crisis — the transition from $5m to $10m — is failed by roughly two of three survivors. Functional managers exist but the founder will not let go. Decisions queue at the founder's desk. The most talented of the second-tier managers, recognising that their growth is blocked, leave. The firm stalls because its operating model cannot evolve from "founder delegates tasks" to "managers make decisions."
Stage 3 — Success ($2.5–10m)
Firms that survive both crises arrive at Success — Churchill and Lewis's third stage. The firm now has the structural option of remaining stable and profitable (Success-Disengagement, in their terminology) or pushing for growth (Success-Growth). Many founders choose Success-Disengagement, either explicitly or by failing to make the decision at all. The firm becomes a comfortable, high-cash-flow lifestyle business.
For those that push for growth, the next crisis — control — is the most insidious. Delegated managers, finally empowered, go their own way. Pricing drifts. Quality drifts. Practice leaders run silos. The firm requires a second-line management infrastructure — controller, head of HR, head of operations — that did not exist before. Two-thirds of firms that attempt this transition fail.
Stage 4 — Take-off ($10–20m)
This is the wall. The Take-off stage requires the firm to function as a genuinely delegated institution. The founder, if still operating, must be a chairman or CEO, not a senior practitioner. The firm needs governance, audit-grade reporting, formal succession planning, and a sales engine that runs without the founder personally closing deals. The work-mix has shifted from predominantly Brains to predominantly Grey Hair.
Nine of every ten firms that attempt this transition fail. The Red Tape crisis is the steepest cliff in the funnel. Institutionalisation kills speed; speed loss kills morale; morale loss costs the talented operators who held the firm together through Stages 2 and 3. Many firms exit at this point — either as a planned trade sale or, more commonly, by simply ceasing to grow.
Stage 5 — Resource Maturity ($20m+)
Firms that cross the Red Tape wall enter Resource Maturity. They are now institutions in the technical sense: their operating model can survive the loss of any individual including the founder. They face one final crisis — Greiner's crisis of internal growth — at roughly $50m revenue. Organic growth runs out; further scale requires M&A, alliances, or platform-style acquisition. The 1-in-22 firms that cross $50m are operating in an entirely different competitive context.
Why the funnel exists
The crises Greiner named are symptoms. The mechanism is Penrose's. Each crisis is a moment at which the firm has attempted to grow faster than its internal pool of managerial capacity can absorb.
This matters because it implies the binding constraint on growth is internal — not market opportunity, not capital availability, not competition. Markets for tech-enabled advisory services have grown at compound rates of 8–12% annually for two decades. Capital has been abundant. Competition, in the LMM segment specifically, is fragmented. Yet the funnel persists.
The reason is that managerial capacity cannot be bought 1-for-1 from the external market. Experienced managers inside a firm hold tacit knowledge — of customers, systems, culture, decision rights, informal relationships — that takes 12–24 months to rebuild from outside. When growth requires the firm to roughly double headcount between revenue thresholds, the layers, processes, and information flows the larger firm needs were not present in the smaller one and cannot be installed instantly. The Penrose effect — empirically confirmed in studies by Tan (2005), Lockett et al. (2011), and Coad et al. (2019) — predicts exactly the funnel we observe.
This insight is what makes the lifecycle so resistant to short-cuts. Capital alone does not fix it; private equity capital injected into a firm that has not survived the autonomy crisis does not fast-forward it through the control crisis. Hiring senior people from outside does not fix it; those senior people lack the internal context to be effective until they have absorbed it. There is no purchasable substitute for organisational maturity.
Each crisis is a buying moment
For the advisor, the crucial insight is that each crisis is the trigger for a distinct pattern of external help-seeking. Founders rarely understand which crisis they are in. They consistently buy the wrong help, from the wrong advisors, until the crisis is acute enough that they buy from someone with the specific expertise the moment requires.

At the leadership crisis, founders hire accountants, solicitors, bookkeepers, and (increasingly) executive coaches. These are mostly compliance and process-of-thought purchases. The advisor's economic capture is small — typical fee bands run from £2–10k a month for a coach, low five-figures for accountancy. But the relationship is foundational; founders rarely change these advisors as the firm grows, which is why incumbent accountants and lawyers continue to capture work the firm has long outgrown.
At the autonomy crisis, the demand pattern shifts decisively to fractional CFOs, org-design consultants, head of HR/search, and continued executive coaching. The founder has finally accepted that the firm needs structural help, not just task help. Fees rise sharply — £3–10k a month for a fractional CFO, £25–80k for an org redesign engagement, retained search fees of 25–30% on senior hires that now cost £150k+.
At the control crisis, the demand pattern shifts again. The firm is now buying strategy consulting, tech/data/AI capability, an upgrade of the CFO function from fractional to full-time, and — for the first time — growth-capital advisors. The fee bands escalate dramatically. A strategy review from a boutique can run £75–250k. A tech and AI enablement engagement can run £100k+. The total advisor spend at a $10m firm crossing the control crisis is often equivalent to 6–10% of revenue.
At the Red Tape wall — the institutionalisation crisis — the demand pattern shifts to exit planning. Exit planners, vendor due diligence, tax structuring, independent non-executive directors. The founder is now contemplating, or being forced to contemplate, what the firm is worth and what it would take to sell it. The fee economics are radically different: success fees of 2–5% on transaction value, retainers of £20–50k a month, vendor DD packages of £150–500k.
At the Internal Growth crisis — the rare 1-in-22 transition to $50m+ — the demand is dominated by M&A advisors, transaction lawyers, W&I (warranty and indemnity) brokers, and wealth managers for the founder's post-transaction wealth.
The total addressable advisor fee pool is not evenly distributed across the funnel. Roughly 70% of the lifetime advisor fees a firm will ever pay are paid in the last 18 months of its independent existence — at and around the Red Tape wall. This is why the LMM exit-advisor market is intensely competitive and why pre-emptive positioning at the start of the Take-off stage is the highest-leverage move an advisor can make.
The exit lattice
The implication of the funnel for exit options is direct: most exit pathways are not real options for most firms, because most firms have not survived the prerequisite crisis to access them.
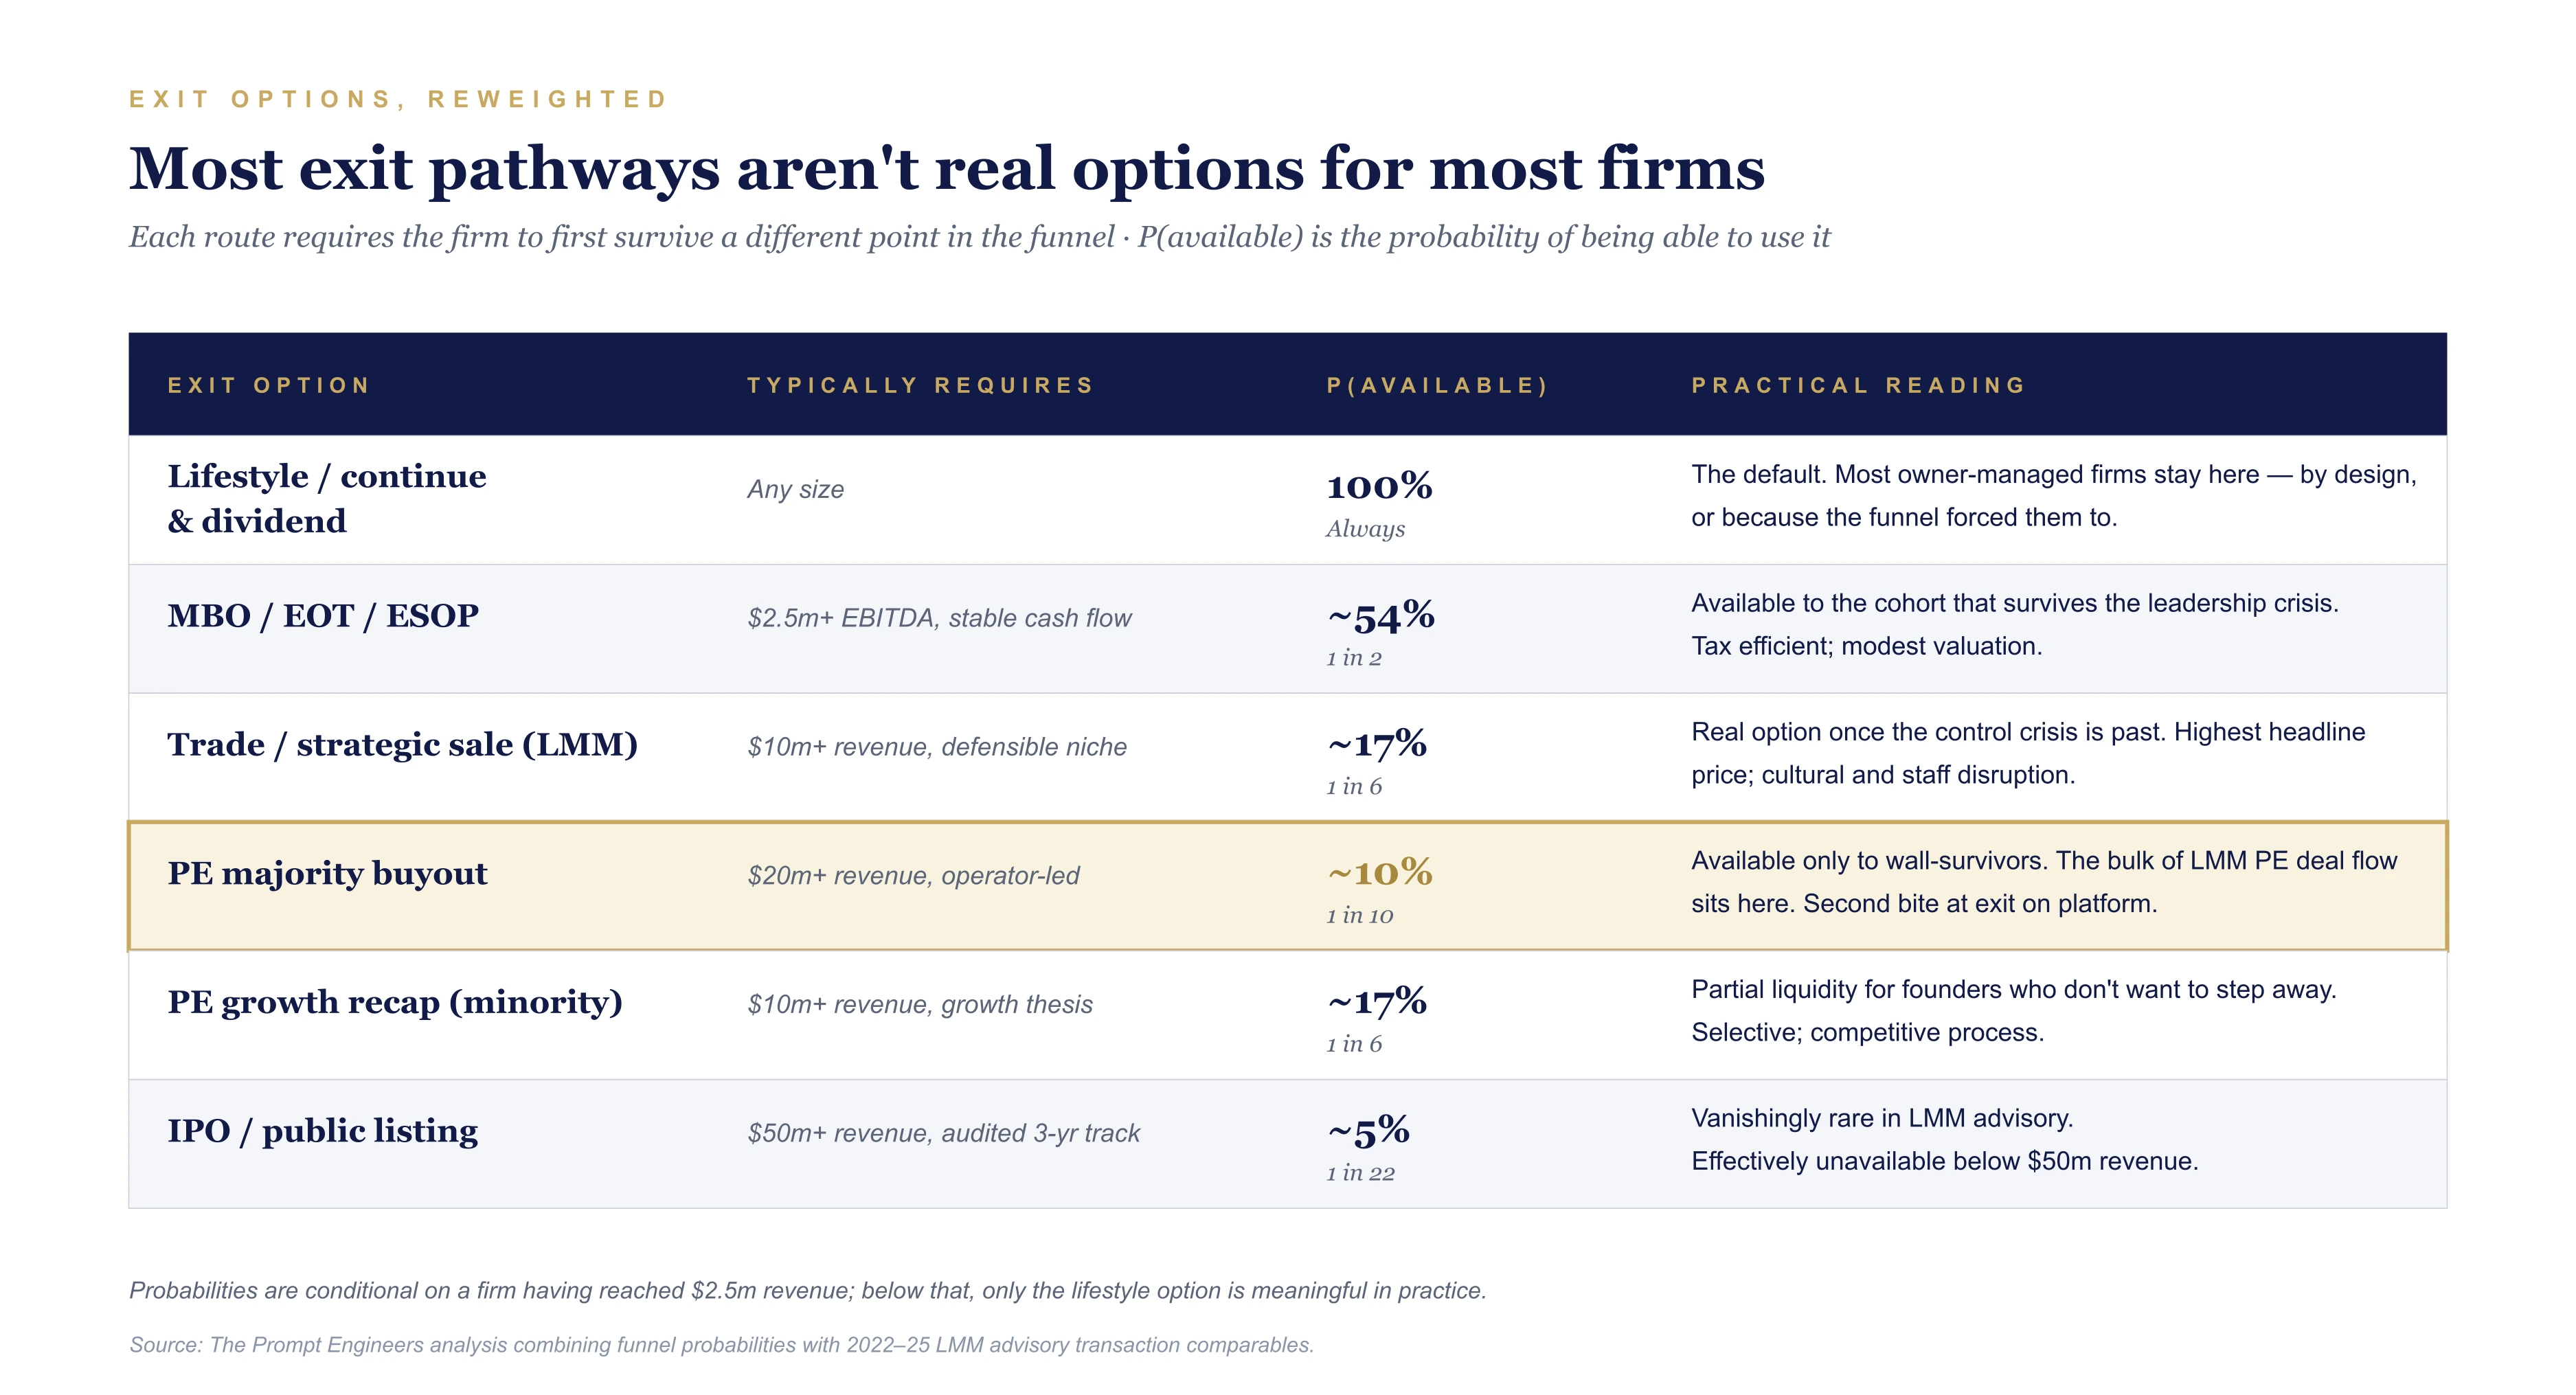
The default exit is no exit — the lifestyle business that continues paying dividends to the founder until they retire or close it down. This is universally available, and it is the chosen path of the majority of owner-managed advisory firms whether they admit it or not. The default is not failure; it can be a perfectly rational outcome.
The MBO / EOT / ESOP route is available to roughly the 54% of firms that survive the leadership crisis. Tax efficient. Modest valuation. Cultural continuity. Increasingly popular in the UK in the wake of the Employee Ownership Trust reforms.
The trade or strategic sale to a larger LMM acquirer is available to roughly the 17% of firms that survive the control crisis — those that have reached $10m+ revenue with a defensible niche. Highest headline price. Cultural and staff disruption.
The headline LMM exit — a private equity majority buyout — is available only to the 10% of firms that have survived the Red Tape wall. The deal structures are well known: 5–10x EBITDA at typical entry multiples for $20–50m revenue businesses in tech-enabled advisory; founder rollover of 20–40%; a second bite at exit on platform 3–5 years later.
PE growth recap — a minority transaction that preserves founder control — is available at roughly the same probability as a trade sale (1 in 6). It is the right answer for founders who do not want to step away, but it is highly selective and intensely competitive on the buy-side.
IPO — public listing — is effectively unavailable below $50m revenue in the LMM advisory segment. The 1-in-22 firms that reach that threshold could IPO in principle, but in practice almost none do, given the disclosure costs and governance overhead relative to the alternative of remaining private and selling at scale.
A firm sold at the end of Stage 3 yields approximately $5m. The same firm patiently scaled through to Stage 4 yields approximately $30m. Six times the outcome for roughly three times the time. Founders systematically under-value the option to wait.
What AI changes
The lifecycle Maister and Greiner described took 15–25 years to traverse from $1m to $20m for the firms that succeeded. The 2022 firm-count data still shows that broad timing.
AI is now compressing it sharply. Three things are happening simultaneously.
First, the kind of work shifts faster. What Maister observed as a 5–10 year flow from Brains to Grey Hair to Procedure now plays out in 12–18 months on AI-enabled work-types. Generative AI commoditises whole categories of Grey Hair work — market analysis, due diligence, contract review, financial modelling, business writing — into Procedure-level efficiency in months, not decades. This is good news for clients and bad news for any advisory firm whose competitive moat sits in Grey Hair territory without a continuous refresh into new Brains domains.
Second, the shape of the firm changes. Harvard Business Review's AI Is Changing the Structure of Consulting Firms (Duncan, Anderson and Saviano, September 2025) documents what they call "the obelisk" — a firm shape with fewer junior layers, smaller teams, senior-heavy delivery augmented by AI facilitators and engagement architects. The traditional pyramid leverage economics that funded the profit-and-loss of the larger firms — many juniors leveraged off few partners — is structurally weakened. Greiner's autonomy and control crises arrive earlier and harder, because the manager-of-managers tier never gets fully built.
Third, the pricing model shifts. Deloitte's 2025 Professional Services Benchmark reports that firms retaining time-based pricing grew 2.1% per annum in 2024–25; those operating value- or outcome-based models grew 8.7%. Thomson Reuters' 2025 Future of Professionals survey records 56% adoption of generative AI in professional services but only 24% production deployment — what the report calls the billable-hour paradox: firms know they need to change, but their economics depend on continuing not to.
The combined effect is to amplify the funnel, not soften it. The empirical probabilities will get worse before they get better; the firms that fail to navigate the AI inflection will fail faster, and the firms that succeed will be more concentrated. The 1-in-22 figure for the $50m threshold is, on current trajectory, likely to fall toward 1-in-30 or worse over the next five years.
What this means for advisors
Five practical implications for advisors operating in the LMM tech-enabled advisory market.
One: name the stage before selling the service. The single most common mistake we observe in advisory positioning is selling Stage 4 services to a Stage 2 firm, or Stage 1 services to a Stage 3 firm. Founders rarely know which stage they are in. Naming it — accurately and unprompted — is the most powerful credibility signal an advisor can offer. A diagnostic, a maturity assessment, or a productised audit that returns the founder a credible picture of where the firm actually sits is worth more, commercially, than the service that follows.
Two: sell against the next crisis, not the next stage. Founders do not buy stage labels. They recognise crises — pain, disorder, talent loss, margin compression — long before they recognise the abstract phase they are in. Frame the offering around "when your delegation crisis hits, here is what we do" rather than "when you reach the Take-off stage, you'll need…".
Three: concentrate business development on the $10–20m bridge. The 1-in-6 to 1-in-10 transition is the steepest cliff in the funnel — and the firms in that transition are simultaneously at peak advisor receptivity and peak willingness to pay for outcome-based fees. This is the highest-yield zone for any advisor whose practice extends across multiple stages.
Four: build pods, not point engagements. A coordinated pod of fractional CFO + tax + legal + coach across Stages 2–4 captures multi-crisis fee value, with the same client, over 5–8 years. Point engagements at the exit point are higher per-fee but lower probability of conversion and much shorter relationship arcs. The economics favour pods.
Five: re-baseline the serviceable addressable market. TPE's real serviceable market in the UK + US LMM advisory segment is not the 582,000-firm population. It is the roughly 7,200 firms above $8m revenue across the UK and US, of which only the ~1,900 UK and ~5,300 US firms sit in the $1–20m EBITDA target zone. Capacity plans, BD plans, and partner economics should be sized to that number — not to the addressable-firm count that the public-domain reports cite.
A note on method
The funnel data in this article is empirical and reproducible. The frameworks — Penrose, Greiner, Churchill-Lewis, Maister — are interpretive lenses; we use them to explain the data, not the other way around. The crisis labels and stage names are not unique to this analysis; they are the canonical vocabulary of six decades of professional service firm literature.
Two important caveats. First, stage-of-growth theories have been challenged empirically — notably by Levie and Lichtenstein (2010) and Phelps, Adams, and Bessant (2007) — for over-specifying a deterministic sequence that real firms rarely follow tidily. We agree with the criticism and apply the frameworks as interpretive maps rather than predictive models. The funnel data is the spine; the stage labels are the joints.
Second, the probabilities cited are population-level conditional probabilities, not deterministic predictions for any individual firm. Any individual firm with a brilliant founder, a defensible niche, and aligned capital can do considerably better than the conditional average. The funnel describes the population, not the exception.
Sources and citations
Empirical data
- Office for National Statistics, UK Business: Activity, Size and Location 2022, Table 9.
- US Census Bureau, 2022 County Business Patterns and 2022 Economic Census, released April 2025 (DRB approval CBDRB-FY25-0227).
Theoretical foundations
- Penrose, E. (1959). The Theory of the Growth of the Firm. Oxford: Basil Blackwell.
- Greiner, L. E. (1972, revised 1998). "Evolution and Revolution as Organizations Grow." Harvard Business Review.
- Churchill, N. C. & Lewis, V. L. (1983). "The Five Stages of Small Business Growth." Harvard Business Review, May–June 1983.
- Maister, D. H. (1993). Managing the Professional Service Firm. New York: Free Press.
- Maister, D. H. (1997). True Professionalism. New York: Free Press.
AI inflection
- Duncan, D., Anderson, T. & Saviano, J. (2025). "AI Is Changing the Structure of Consulting Firms." Harvard Business Review, September 2025.
- Thomson Reuters Institute (2025). Future of Professionals Report.
- Deloitte (2025). Professional Services Benchmark Study.
Empirical caveats
- Levie, J. & Lichtenstein, B. B. (2010). "A Terminal Assessment of Stages Theory." Entrepreneurship Theory and Practice, 34(2), 317–350.
- Phelps, R., Adams, R. & Bessant, J. (2007). "Life cycles of growing organizations." International Journal of Management Reviews, 9(1), 1–30.
- Coad, A., Daunfeldt, S. O. & Halvarsson, D. (2019). "Bursty firm growth and the Penrose effect."
- Tan, D. (2005). "Tests of the Penrose effect." Strategic Management Journal.

Mastering the S-Curve: AI Adoption in People, Processes, and Technology

Building Trust with Clients Through AI-Enabled Maturity Workshops

The Art and Science of AI Enhanced Consulting: Balancing Technology and Human Insight